Data & Maps
Upcoming Elections
Historical Statistics
Voter Data
Maps and Geodata
Historical Voter Turnout Statistics
| Year | Estimate of Eligible Voters | Number of Voters | Percent Turnout | Number of Election Day Registrations | Percent of Voters Registering on Election Day |
|---|---|---|---|---|---|
| 2024 | 4,285,809 | 3,272,414 | 76.35% | 296,287 | 9.05% |
| 2022 | 4,140,218 | 2,525,873 | 61.01% | 141,095 | 5.59% |
| 2020 | 4,118,462 | 3,292,997 | 79.96% | 259,742 | 7.89% |
| 2018 | 4,064,389 | 2,611,365 | 64.25% | 213,999 | 8.19% |
| 2016 | 3,972,330 | 2,968,281 | 74.72% | 353,179 | 11.90% |
| 2014 | 3,945,136 | 1,992,566 | 50.51% | 152,101 | 7.63% |
| 2012 | 3,876,752 | 2,950,780 | 76.11% | 527,867 | 17.89% |
| 2010 | 3,799,358 | 2,123,369 | 55.89% | 227,857 | 10.73% |
| 2008 | 3,741,514 | 2,921,498 | 78.08% | 542,257 | 18.56% |
| 2006 | 3,667,707 | 2,217,818 | 60.47% | 292,168 | 13.17% |
| 2004 | 3,609,185 | 2,842,912 | 78.77% | 581,904 | 20.47% |
| 2002 | 3,518,184 | 2,282,860 | 64.89% | 342,978 | 15.02% |
| 2000 | 3,506,432 | 2,458,303 | 70.11% | 464,155 | 18.88% |
Download pdf of Primary and General Election Turnout since 1950
Download spreadsheet of Primary and General Election Turnout since 1950
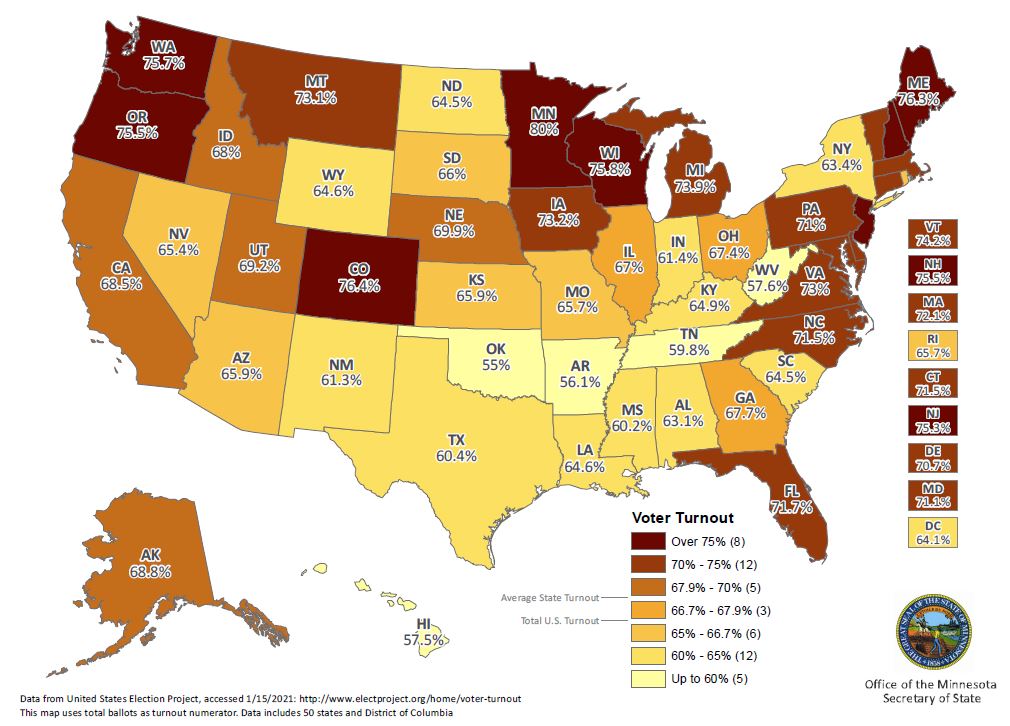
Maps of Voter Turnout
